
Submission 2025
| Submitted by: | Cole Graham |
| Department: | Earth + Atmospheric Sciences |
| Faculty: | Science |
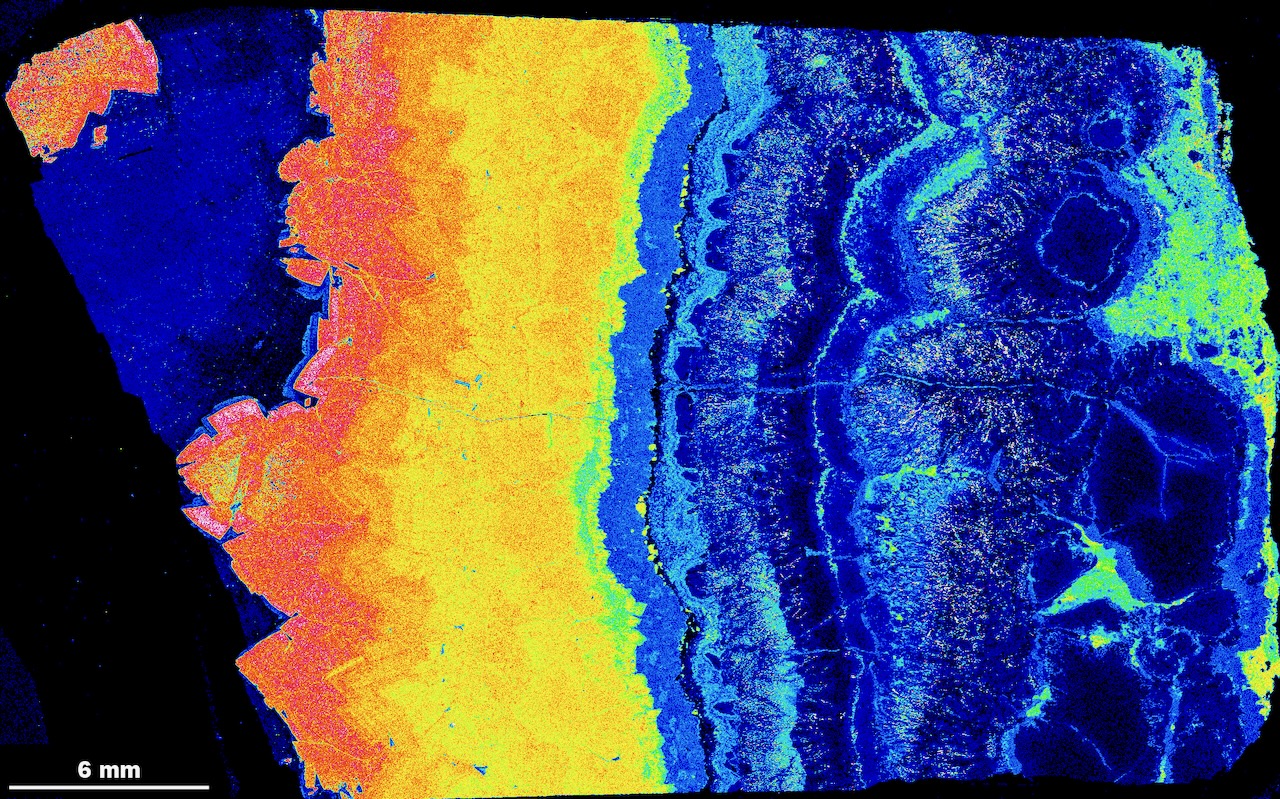
Mapping of the relative Fe content of minerals in a hydrothermal vein from the Easter-Duffy Deposit, Northwest Territories, Canada, revealed strong zonation in both carbonate and sulfide-arsenide minerals. Analysis was performed at the University of Alberta on a Cameca SX100 Electron Microprobe, with an artificial colour gradient applied via ImageJ.
On the left, strongly-zoned dolomite, Ca(Mg,Fe)(CO3)2, is followed by Fe-poor calcite, CaCO3. The right side consists of Fe-poor nickeline, NiAs, with alternating bands of more Fe-rich gersdorffite, (Ni,Fe)AsS, and tiny inclusions of pyrrhotite, Fe(1-x)S (extremely rich in Fe). These changes in Fe concentration provide insight into the evolution of the mineralizing fluid, and the presence of multiple generations of mineralization. This analysis was key in describing the paragenesis of ore minerals at this five-element vein type deposit.
Was your image created using Generative AI?
No.
How was your image created?
Ore mineralization at Easter-Duffy is hosted in multiple generations of carbonates, primarily dolomite. Generations of dolomite and paragenetic relationships were constrained via qualitative mapping of carbonate chemistry. This was done by electron microprobe (EPMA) at the University of Alberta on a Cameca SX100 Microprobe equipped with five wavelength-dispersive spectrometers, with one specifically analyzing the Fe Kα x-ray line via LIF crystal. Prior to analysis, a 25 nm thick conductive carbon coating was applied to samples. Beam current was set to 100 nA, accelerating voltage to 20 kilovolts, beam size to 10μm, and pixel size was 20 x 20 μm with a dwell time of 10-20 msec per pixel.
Relative intensity maps were then processed in the ImageJ software to apply false colour gradients for ease of viewing and interpreting. Generations of carbonate and associated paragenetic relationships were established using relationships with known minerals, textures, and patterns within individual relative intensity maps, keeping in mind uncertainties associated with qualitative methods such as this.
Where is the image located?
Electron Microprobe Laboratory, Department of Earth and Atmospheric Sciences, University of Alberta – Acquired through EPMA analysis.