
Semi-finalist 2025
| Submitted by: | Liam Easton |
| Department: | Renewable Resources |
| Faculty: | Agricultural, Life + Environmental Sciences |
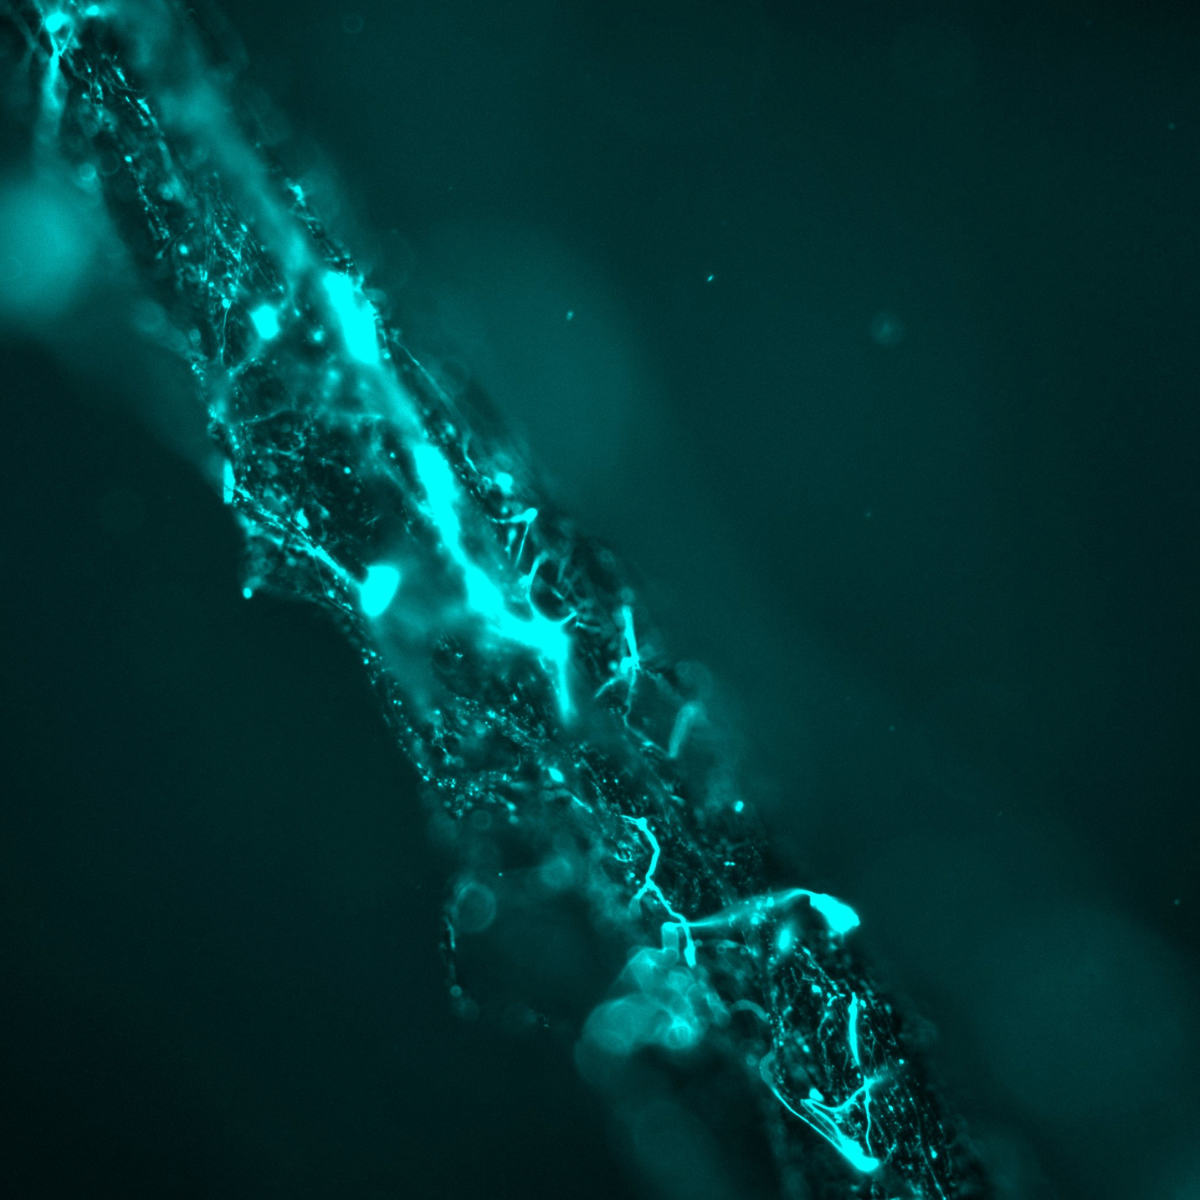
The image shows a longitudinal section of a rhizomorph of Armillaria ostoyae, a root-rot basidiomycete important in boreal and temperate forests. Rhizomorphs are cord-like bundles of thousands of hyphae that conduct water, nutrients, and (potentially) electrical signals over centimetres to metres of substrate.
For my project on fungal electrophysiology, the sample was stained with the slow-response voltage-sensitive dye DiBAC₄(3). The dye enters cells that experience membrane depolarisation and increases in fluorescence proportional to the loss of negative membrane potential. High-intensity patches (cyan) therefore mark hyphal segments with transient or sustained depolarization, while dimmer regions remain close to resting potential.
Mapping the spatial distribution of depolarized zones is the first step in quantifying how electrical activity is organized within multicellular fungal structures and in parameterizing cable-theory models of signal propagation in rhizomorph networks.
Was your image created using Generative AI?
No.
How was your image created?
A four-week-old potato-dextrose-agar culture of Armillaria ostoyae produced actively growing rhizomorphs. Individual cords were excised, rinsed twice in citrate-phosphate buffer (pH 6.0) and incubated 30 min in 10 µM DiBAC₄(3). Because this anionic dye enters depolarized membranes, fluorescence intensity is proportional to local loss of negative membrane potential. After two brief buffer washes the living rhizomorph was mounted in a #1.5 glass-bottom dish containing the same buffer (~0.5 mm depth) and imaged immediately.
Imaging was performed on a Leica DMI8 THUNDER wide-field system fitted with an HC PL FLUOTAR 20×/0.50 dry objective. A Leica K8 sCMOS camera (2048 × 2048 px, 16-bit) yielded a lateral sampling of 0.65 µm px⁻¹. A single fluorescence channel was acquired (470 ± 20 nm excitation, 525 ± 25 nm emission) with 12 ms exposure at 25 % LED output. To confirm temporal stability a 69-frame time series (1.12 s per frame; total 31.5 s) was collected; the submitted image is the highest-signal frame. Leica “small-volume computational clearing” removed out-of-focus light; no other processing or resampling was applied.
Where is the image located?
Cell Imaging Core, University of Alberta.