Submission 2024
| Submitted by: | Anirudh Chaitanya Kembre |
| Department: | Mechanical Engineering |
| Faculty: | Engineering |
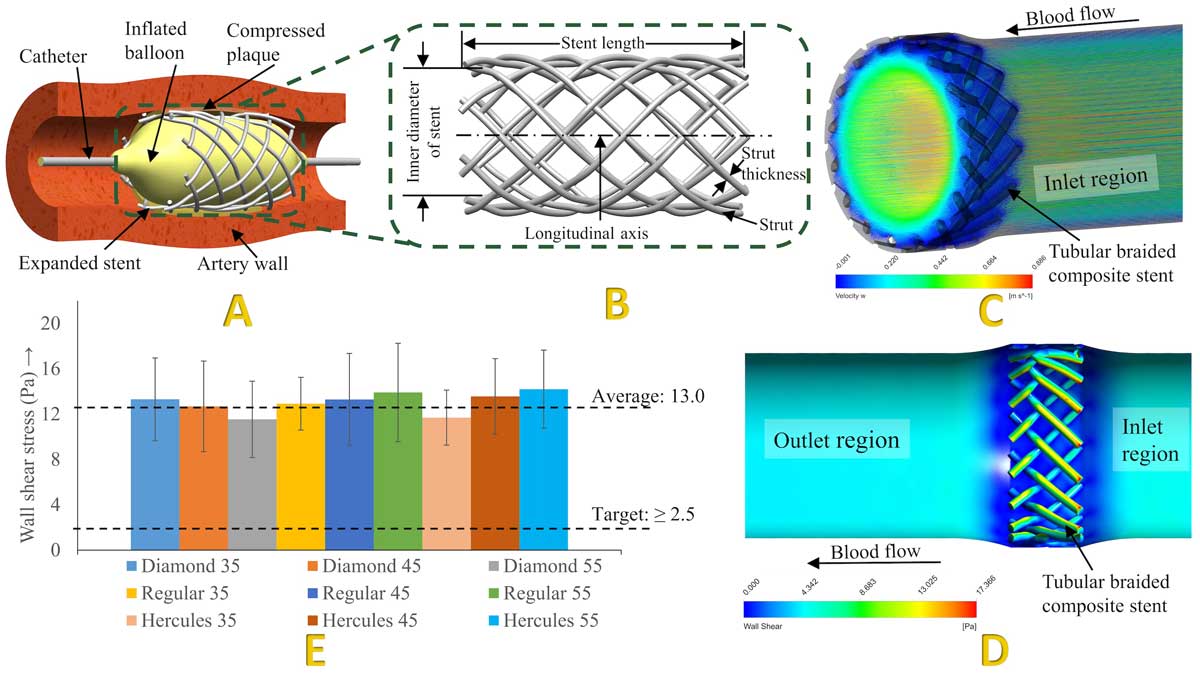
This image is a visual narrative of my research on tubular braided composite (TBC) stents, poised to revolutionize cardiovascular treatments. The study aims to model and simulate TBC stents, focusing on wall shear stress (WSS) analysis post-deployment. “A” vividly depicts the stent deployment process, where the stent expands within the artery, displacing plaque and restoring blood flow. “B” zooms into the TBC stent’s meshwork, emphasizing its features. “C and D” transition to the simulation phase, where color maps trace blood flow and WSS through the stent via Ansys FLUENT®. The research spans nine stent designs to assess their impact on wall shear stress. The bar graph in “E” quantifies the research findings, presenting WSS data for the nine TBC stents. Stent #9 peaks with 14.2 Pa, while stent #6 (13.9 Pa) and stent #8 (13.6 Pa) closely follow. The results suggest that all stents have an average WSS in the acceptable range (≥ 2.5 Pa) for stent use. In conclusion, TBC stents resulting in higher mechanical strengths must be designed. Further experimental work needs to be conducted to validate the simulation results and expand on the viability of TBC stents.
Was your image created using Generative AI?
No.
How was your image created?
Data from three software platforms – Solidworks, Ansys Fluent, and Microsoft Excel – were extracted and imported into a PowerPoint slide. This was not just pasting, but a strategic arrangement of information to form a clear narrative. Each element in this digital collage was carefully labeled, ensuring traceability. Contextual descriptions transformed the collection of data into a readable story. The result was a unified image, a testament to the power of these software tools and the skill that used them. This was achieved without artificial intelligence or photo editing tools, making the image a pure expression of data visualization. Ultimately, it was not just an image that was created, but a visual symphony of data. Each component was orchestrated to create a harmonious whole, leaving the audience with a sense of awe and a deeper understanding of the biomedical applications of tubular braided composite materials.